Part 4 “Mobile & In-App KPIs: Beyond the Install”
App Installs • Sign-ups • In-App Purchases • Subscription Start / Renewal • Add-to-Cart • Level Completion • Custom Events • Retention & Churn
The Install Illusion (now with the morning-after scene)
Slack sirens blare: “Top-10 in the App Store!” Rocket emojis everywhere, Zoom high-fives, confetti GIFs. Then morning hits: support tickets spike, the CFO pings “Why is revenue flat?” and yesterday’s champagne suddenly tastes like seltzer. Installs feel like victory, but they are just unlocked doors.
1. Installs Are Not Customers
Why teams get fooled: acquisition dashboards spike and everyone loves a hockey stick.
Warning signs:
- Day-1 retention (D1) below 30% or Day-7 (D7) below 10%
- First-launch session under 60 seconds
Fix it:
- Track Day-1, Day-7, Day-30 (D1/D7/D30) retention on a single chart every sprint
- Segment by acquisition source; pause any channel that burns users inside 24 hours
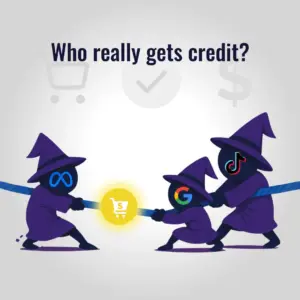
iOS 14+ reality: SKAdNetwork limits attribution windows to 24-48 hours. Focus on immediate value signals and model longer-term LTV from early behavior patterns.
2. Monetization Metrics: Purchases & Subscriptions
What keeps the lights on:
- ARPDAU: aim for $0.05-$0.20 in casual games, $1+ in niche SaaS
- Subscription lag: users who pay after Day-7 churn two to three times faster; surface paywalls while intent is hot
- Renewal rate: Month-3 renewals above 70% usually put CAC payback inside nine months
- First-$1 path in three beats: welcome paywall, time-boxed trial, loyalty booster. Nail that sequence and you shorten payback by whole quarters
3. Funnel Drop-offs: Cart and Level Completions
Spot the leaks:
- E-commerce app: Add-to-cart 30% but checkout 8% = shipping shock or clunky pay flow
- Game: Level-1 completion 95% yet Level-3 falls to 55% = difficulty cliff or ad fatigue
Real-world micro-case: switching the default payment option to Apple Pay cut checkout drop-off from 22% to 9% in two sprints.
Fix it:
- Instrument each step with event IDs; replay rage-tap sessions to find blockers
- A/B-test guest checkout or revive players with a “Skip Level” micro-offer
4. Custom Events & Cohort Analysis
The product-led growth toolbox:
- Define “aha” moments: first playlist created, first property saved, second workout logged
- Chart weekly cohorts side by side; look for retention lifts after each release
- Quick cohort math: DAU ÷ MAU = stickiness; the area under the retention curve is a solid LTV proxy
- Trigger lifecycle pushes: if no success moment by Day-3, send a contextual nudge (video tip, 10% gem pack)
Real example: A meditation app found that users who completed 3 sessions in their first week had 85% D30 retention vs 20% for single-session users. They redesigned onboarding to drive that third session.
Key Takeaways
- Retention beats reach. Installs without Day-30 stickiness are empty calories
- Follow the money. Purchases, subscriptions, and renewals tell you when CAC finally pays rent
- Mind the micro-funnels. Small drop-offs compound into massive revenue leaks
- Events over vanity. Instrument the moments that matter, cohort-slice them, and tighten the loop
Next up: Part 5, “Pipeline & Persona Metrics: Translating Ad Clicks Into Revenue”: We’ll trace each paid click through the CRM, map hand-raisers to personas, and show how marketing can predict revenue instead of just reporting spend.